


 Now you can get the latest Java source bundled with each app update. Install the app from Google Play and go to Settings > Extras.
Create a currency converter application using Yahoo! API
 Download
Keywords: ConnectivityManager HttpGet XmlPullParser SAXParser SimpleCursorAdapter SQLiteDatabase ContentProvider SQLiteQueryBuilder BroadcastReceiver IntentService AChartEngine Search Dialog Animation TableLayout
Contents
- Overview
- Create a new Eclipse Android project
- Define the Data model
- The Android Manifest file
- The Application class
- Create a Preferences screen
- Implement the Init Task
- The Yahoo! Finance API
- The XmlPullParser
- The SAX Parser
- Calling RESTful service
- Implement the Data Service
- Create a splash screen
- Create the Main screen
- The Search Dialog
- Create the Info screen
- The AChartEngine library
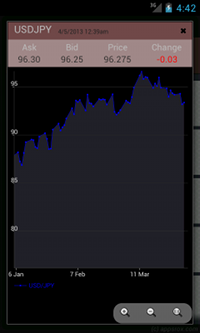
16. Create the Info screen
The Info screen displays Ask, Bid, Price, etc. values for the given currency pair as well as a chart to show historical exchange rates. We make use of TableLayout as it creates a table structure to display the values.<TableLayout android:layout_width="fill_parent" android:layout_height="wrap_content" android:shrinkColumns="*" android:stretchColumns="*" > <TableRow android:layout_width="wrap_content" android:layout_height="wrap_content" > <TextView android:layout_width="wrap_content" android:layout_height="wrap_content" android:gravity="center_horizontal" android:text="@string/ask" /> <TextView android:layout_width="wrap_content" android:layout_height="wrap_content" android:gravity="center_horizontal" android:text="@string/bid" /> <TextView android:layout_width="wrap_content" android:layout_height="wrap_content" android:gravity="center_horizontal" android:text="@string/price" /> <TextView android:layout_width="wrap_content" android:layout_height="wrap_content" android:gravity="center_horizontal" android:text="@string/change" /> </TableRow> <TableRow android:layout_width="wrap_content" android:layout_height="wrap_content" > <TextView android:id="@+id/ask_tv" android:layout_width="wrap_content" android:layout_height="wrap_content" android:gravity="center_horizontal" /> <TextView android:id="@+id/bid_tv" android:layout_width="wrap_content" android:layout_height="wrap_content" android:gravity="center_horizontal" /> <TextView android:id="@+id/price_tv" android:layout_width="wrap_content" android:layout_height="wrap_content" android:gravity="center_horizontal" /> <TextView android:id="@+id/change_tv" android:layout_width="wrap_content" android:layout_height="wrap_content" android:gravity="center_horizontal" /> </TableRow> </TableLayout>The InfoActivity simply loads the Quote from the database and sets value to the TextViews.
	public class InfoActivity extends Activity {
		private SQLiteDatabase db;
		private Calendar cal = Calendar.getInstance();

		private TextView pairText;
		private TextView askText;
		private TextView bidText;
		private TextView priceText;
		private TextView changeText;
		private TextView timeText;
		private LinearLayout layout;

		private String pair;

		@Override
		protected void onCreate(Bundle savedInstanceState) {
			super.onCreate(savedInstanceState);
			requestWindowFeature(Window.FEATURE_NO_TITLE);
			setContentView(R.layout.info);

			// TODO find views by id

			db = ForexWiz.db;
			long symbolId = getIntent().getLongExtra(Constants.EXTRA_ID, 0);
			Symbol symbol = new Symbol(symbolId);
			symbol.load(db);

			pair = ForexWiz.getBaseCurrency() + symbol.getCode();
			Quote quote = new Quote(pair);
			quote.load(db);

			// TODO set values to text views from quote
		}
	}
Now declare the activity in the manifest and set the theme to Theme.Dialog.
	<activity android:name=".InfoActivity"
				android:theme="@android:style/Theme.Dialog"></activity>
17. AChartEngine library
 Add a place holder for the chart view below the table layout in info.xml as follows.
	<LinearLayout android:id="@+id/chart"
				android:orientation="horizontal"
				android:layout_width="fill_parent"
				android:layout_height="0dip"
				android:layout_weight="1" />
The layout weight is set to 1 so that it expands to fill the vertical space.
We will plot a time chart and use XYMultipleSeriesRenderer provided by AChartEngine to render the chart. Here is how we create the renderer.
	private XYMultipleSeriesRenderer getRenderer() {
	    XYMultipleSeriesRenderer renderer = new XYMultipleSeriesRenderer();
//	    renderer.setApplyBackgroundColor(true);
//		renderer.setBackgroundColor(Color.BLACK);
	    renderer.setAxisTitleTextSize(16);
	    renderer.setChartTitleTextSize(20);
	    renderer.setLabelsTextSize(15);
	    renderer.setLegendTextSize(15);
	    renderer.setPointSize(2f);
	    renderer.setShowGridX(true);
	    renderer.setGridColor(getResources().getColor(R.color.txt));
	    renderer.setMargins(new int[] {10, 15, 10, 10});
	    renderer.setPanEnabled(true, false);
	    renderer.setZoomButtonsVisible(true);

	    renderer.setXAxisMax(cal.getTime());
	    cal.add(Calendar.DATE, -ForexWiz.getVisibleRange());
	    renderer.setXAxisMin(cal.getTime());

	    XYSeriesRenderer r = new XYSeriesRenderer();
	    r.setColor(Color.BLUE);
	    r.setPointStyle(PointStyle.CIRCLE);
	    r.setFillPoints(true);
	    r.setFillBelowLine(true);
	    r.setFillBelowLineColor(getResources().getColor(R.color.bkg));
	    renderer.addSeriesRenderer(r);

	    renderer.setAxesColor(Color.DKGRAY);
	    renderer.setLabelsColor(Color.LTGRAY);
	    return renderer;
	}
Finally, we need historical exchage rates to create a data set required to plot the chart. Yahoo! API allows us to query for historical data.
http://ichart.yahoo.com/table.csv?s=JPY=XYou can pass additional parameters to the query to set the date range for which you want the data. e.g. a,b,c,d,e,f,g. For more details check this page.
http://ichart.yahoo.com/table.csv?s=JPY=X&a=0&b=1&c=2000&d=0&e=31&f=2010&g=d
Do note that the base currency is USD for the exchange rates.
Next, we will create an AsyncTask which would fetch historical data and parse the CSV values to create a TimeSeries for the chart view. You may refer this section on how to make a REST call and get the result.
	private class ChartTask extends AsyncTask<Date, Void, Void> {
		private static final String URL = "http://ichart.yahoo.com/table.csv?s=";
		private TimeSeries series;

		protected void onPreExecute() {
			series = new TimeSeries(pair);
		}

		@Override
		protected Void doInBackground(Date... params) {
			String result = null;
			BufferedReader br = null;
			SimpleDateFormat sdf = new SimpleDateFormat("yyyy-MM-dd");

			try {
				Date from = params[0];
				Date to = params[1];

				int a = from.getMonth();
				int b = from.getDate();
				int c = from.Year()+1900;
				int d = to.getMonth();
				int e = to.getDate();
				int f = to.Year()+1900;
				char g = 'd';

				StringBuilder sb = new StringBuilder(URL);
				sb.append(pair).append("=X");
				sb.append("&a=").append(a);
				sb.append("&b=").append(b);
				sb.append("&c=").append(c);
				sb.append("&d=").append(d);
				sb.append("&e=").append(e);
				sb.append("&f=").append(f);
				sb.append("&g=").append(g);

				// TODO make a REST call and get the result

				br = new BufferedReader(new StringReader(result));

				String line=br.readLine();
				String[] tokens;
				while ((line=br.readLine()) != null) {
					tokens = line.split(",");
					series.add(sdf.parse(tokens[0]), Util.parseDouble(tokens[4]));
				}
			} catch (Exception e) {
				Log.e(TAG, e.getMessage(), e);
			} finally {
				try {
					if (br!=null) br.close();
				} catch (IOException e) {}
			}
			return null;
		}

		@Override
		protected void onPostExecute(Void param) {
			XYMultipleSeriesDataset dataset = new XYMultipleSeriesDataset();
			dataset.addSeries(series);
			GraphicalView chartView = ChartFactory.getTimeChartView(InfoActivity.this, dataset, getRenderer(), "d MMM");
			layout.addView(chartView, new LayoutParams(LayoutParams.FILL_PARENT, LayoutParams.WRAP_CONTENT));
		}
	}
Now execute the ChartTask in the InfoActivity's onCreate() method or in a button's onClick handler.
	ChartTask task = new ChartTask();
	task.execute();
Additionally, you may want to show a progress dialog to the user while doInBackground() is executed. On completion of the task, onPostExecute() is called by Android which creates the chart view from the data set and adds it to the place holder layout.
This completes the tutorial. You may want to read our previous tutorials which cover UI stuff in more detail.